
AcATaMa#
Thematic maps are indispensable for environmental monitoring, resource management, and policy-making, yet their value depends critically on rigorous accuracy assessment.
AcATaMa (Accuracy Assessment of Thematic Maps) is a free, open-source QGIS plugin that delivers an integrated workflow for thematic map accuracy assessment and sample-based area estimation, enabling users to follow international good practice guidelines within a single, accessible environment.
One set of sample points, labeled once using reference data, gives two complementary results:
Map quality — overall, user’s and producer’s accuracy, reported per class, so you know where the map can be trusted and where it cannot.
Area estimates — area-adjusted class areas with confidence intervals and uncertainty, which correct the bias that affects areas obtained by counting map pixels.
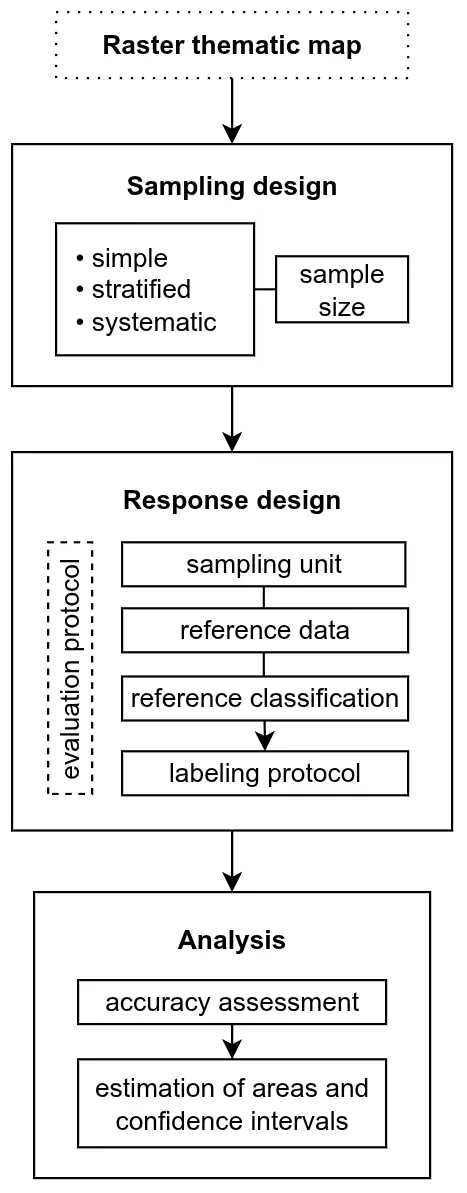
The plugin integrates three core components: sampling design (simple random, stratified random, and systematic), response design (a multi-window interface for simultaneous review of multiple reference data sources), and analysis (error matrices, accuracy metrics, and area-adjusted estimates). By unifying them, AcATaMa provides a complete, end-to-end accuracy-assessment and area-estimation workflow within a desktop GIS environment.
See also
Introduction explains why both results matter and the statistical reasoning behind them.
The Three Components#
The accuracy assessment of thematic maps consists of three key components: sampling design, response design, and analysis. AcATaMa integrates these components through a structured, sequential workflow.
1. Sampling Design#
The sampling design determines how sample units (points) are selected to ensure representativeness and statistical validity [Stehman and Czaplewski, 1998]. AcATaMa supports simple random, stratified random, and systematic designs, with sample-size calculation, allocation control, and post-stratification.
2. Response Design#
The response design involves defining the procedures for obtaining and interpreting reference classifications, ensuring that the comparison between map and reference data is reliable [Olofsson et al., 2014]. A multi-window interface lets several reference-data sources be reviewed side by side while each sample is labeled.
3. Analysis#
Analysis involves quantifying accuracy through error matrices and statistical metrics and estimating class areas with confidence intervals, ensuring scientifically rigorous conclusions [Stehman and Czaplewski, 1998, Olofsson et al., 2014].
Note
Each component is explained in detail in the following pages. The scientific rationale and the full set of estimators implemented for each sampling design are documented in Introduction.
Modular Usage#
Although AcATaMa is designed to follow a sequential three-step workflow for accuracy assessment, the sampling design and response design modules can each be used on their own for other purposes.
Sampling design on its own#
This module needs only a raster to define the area and, optionally, the strata — no labeling step is required afterwards. That makes it useful whenever you need a statistically defensible set of locations:
Field campaigns and ground surveys — generate randomized plot locations, with a minimum distance constraint to prevent clustering and a fixed seed so the selection can be reproduced and audited later.
Training and validation data for classification — draw a stratified sample over an existing class map so rare classes receive enough points, then export the layer for use in any machine-learning or classification workflow.
Recurring monitoring grids — build a systematic grid, by distance or by pixel and with a random offset, for inventories that must be repeated on a consistent spatial framework.
Planning sampling effort — use the sample-size calculator to find how many samples a target standard error requires, before committing field or interpretation resources.
Response design on its own#
This module works on any point layer selected as the sampling file, whether or not AcATaMa generated it, which turns it into a general-purpose visual interpretation environment:
Labeling points from other sources — assign reference classes to points collected by GPS, produced on another platform, or supplied by a third party.
Photo-interpretation campaigns — review several reference sources side by side in the multi-window layout (for example Landsat and Sentinel composites, high-resolution mosaics, and Google Earth) and label each point using customizable buttons and keyboard shortcuts.
Time-series interpretation — inspect trends and breakpoints at each point through the integrated CCD plugin, to establish not only what changed but when.
Applications#
AcATaMa applies to any workflow that requires statistically rigorous map-accuracy assessment and sample-based area estimation, in both research and operational settings. It is used for multiple purposes across different topics, such as land use and land cover change, forest and plantations monitoring, evaluation of classification methods, urban analysis, biodiversity and ecosystems, climatology and climate change, agricultural and crop mapping, watershed and water resources, social analysis, hazard and risk assessment, and coastal and marine studies, reflecting its adaptability across disciplines.